一个基本的性能测试
我们以斐波那契数列为例,来看一个基本的性能测试。
需要测试的文件:
1 2 3 4 5 6 7 func fib (n int ) int { if n == 0 || n == 1 { return n } return fib(n-2 ) + fib(n-1 ) }
测试文件:
1 2 3 4 5 6 7 8 import "testing" func BenchmarkFib (b *testing.B) for i := 0 ; i < b.N; i++ { fib(20 ) } }
我们可以通过执行下面的命令来运行性能测试:
输出结果:
1
2
3
4
5
6
7
goos: darwin goarch: amd64 pkg: go-test cpu: 12th Gen Intel(R) Core(TM) i7-12700F BenchmarkFib-20 47515 25053 ns/op PASS ok go-test 1.451s
说明:
输出字段说明:
goos:操作系统。goarch:CPU 架构。pkg:包名。cpu:CPU 信息。BenchmarkFib-20:测试函数的名字。20 表示
GOMAXPROCS(线程数)的值为 20。47515:测试函数运行的次数。25053 ns/op:每次运行的平均耗时,也就是每次操作耗时
25053 纳秒。
基准测试函数的名字必须以 Benchmark
开头,后面跟被测试的函数名,函数名的第一个字母必须大写。如上面的
BenchmarkFib。
基准测试函数的参数是 *testing.B。
运行基准测试的命令是 go test -bench .,其中
. 表示当前目录。
b.N
是基准测试框架提供的一个参数,表示基准测试函数运行的次数。
如果我们想知道每次操作中内存的分配情况,可以使用
-benchmem 参数:
1 go test -bench . -benchmem
在输出中就会显示每次操作分配的内存情况。
CPU 性能测试及分析
上面的基准测试,我们是直接输出了测试结果,如果我们想要更详细的分析,可以使用
pprof 工具。
我们可以使用下面的测试命令来生成 CPU 性能分析的文件:
1 go test -bench . -cpuprofile=cpu.out
接着,我们可以使用 go tool pprof 来查看分析结果:
输出如下:
1
2
3
4
5
6
File: go-test.test Type: cpu Time: May 10, 2024 at 3:21pm (CST) Duration: 1.61s, Total samples = 1.24s (76.86%) Entering interactive mode (type "help" for commands, "o" for options) (pprof)
我们可以使用 top 命令来查看 CPU 占用最高的函数:
1
2
3
4
5
6
7
8
(pprof) top Showing nodes accounting for 1.24s, 100% of 1.24s total flat flat% sum% cum cum% 1.24s 100% 100% 1.24s 100% go-test.fib 0 0% 100% 1.24s 100% go-test.BenchmarkFib 0 0% 100% 1.24s 100% testing.(*B).launch 0 0% 100% 1.24s 100% testing.(*B).runN (pprof)
我们也可以在 top
命令后面加上一个数字,表示显示前几个占用 CPU 时间最多的函数。比如
top3 表示显示前 3 个。
也就是说,我们可以通过 pprof
工具来查看哪些地方占用了比较多的 CPU
时间,从而进行性能优化。
内存性能测试及分析
上一个例子中,我们并没有在函数中分配内存,我们使用下面这个例子来演示内存性能测试及分析。
需要测试的文件:
1
2
3
4
5
6
7
8
9
10
11
12
13
14
15
16
17
18
19
20
21
22
package mainimport ( "math/rand" "testing" "time" ) func test (n int ) int { rand.Seed(time.Now().UnixNano()) nums := make ([]int , 0 , n) for i := 0 ; i < n; i++ { nums = append (nums, i) } return nums } func BenchmarkItoa (b *testing.B) for i := 0 ; i < b.N; i++ { test(1000 ) } }
执行下面的命令来运行内存性能测试:
1 go test -bench . -benchmem -memprofile mem.out
输出如下:
1
2
3
4
5
6
7
goos: darwin goarch: amd64 pkg: go-test cpu: 12th Gen Intel(R) Core(TM) i7-12700F BenchmarkItoa-20 143871 8169 ns/op 8192 B/op 1 allocs/op PASS ok go-test 1.266s
我们可以看到,在 BenchmarkItoa 这一行中,多了两列,其中
8192 B/op 表示每次操作(每次调用 test
函数)分配了 8192 字节的内存,1 allocs/op
表示每次操作分配了 1 次内存。
这个输出对我们的意义是,尽量减少内存的分配,很多时候可以提高程序的性能。
同样的,我们可以使用 go tool pprof
来查看内存分析结果:
我们在交互模式下,可以使用 top
命令来查看内存分配最高的函数:
1
2
3
4
5
6
7
(pprof) top Showing nodes accounting for 1.20GB, 100% of 1.20GB total flat flat% sum% cum cum% 1.20GB 100% 100% 1.20GB 100% go-test.test 0 0% 100% 1.20GB 100% go-test.BenchmarkItoa 0 0% 100% 1.20GB 100% testing.(*B).launch 0 0% 100% 1.20GB 100% testing.(*B).runN
通过 http
页面的方式展示性能测试结果
我们上面这两个例子还是过于简单了,在实际的项目中,函数调用可能会非常复杂,我们可以通过
web 界面来展示性能测试结果。同时,交互上也会更加友好。
比如,针对上面的
mem.out,我们可以使用下面的命令来启动一个 http 服务:
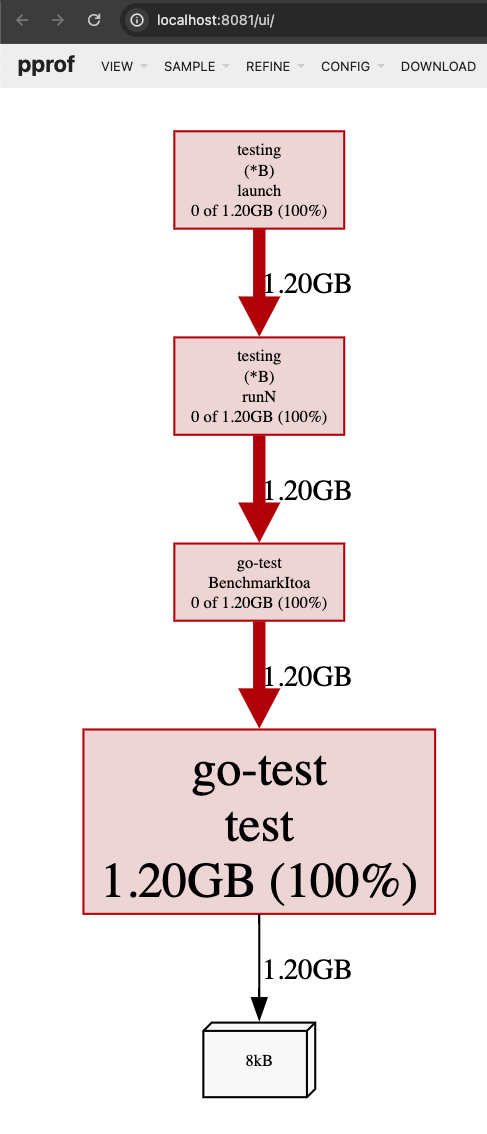
1 go tool pprof -http=:8081 mem.out
接着,我们可以在浏览器中输入 http://localhost:8081
来查看性能测试结果:
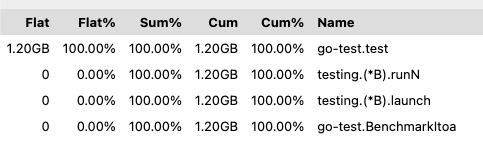
除了直接看到的结果,还可以操作上面的菜单来实现不同的展示方式,比如选择
VIEW->Top,展示出来的是一个列表:
pprof 的其他功能
在我们使用 go tool pprof
的时候,还有很多其他的功能,比如:
top:查看 CPU 或内存占用最高的函数。上面有介绍。list:list
命令后跟函数名称以显示该函数的源代码,突出显示哪些代码占用了最多的 CPU
或内存,如下所示
1
2
3
4
5
6
7
8
9
10
11
12
13
(pprof) list go-test.test Total: 1.20GB ROUTINE ======================== go-test.test in /Users/ruby/GolandProjects/go-test/fib_test.go 1.20GB 1.20GB (flat, cum) 100% of Total . . 9:func test(n int) []int { . . 10: rand.Seed(time.Now().UnixNano()) 1.20GB 1.20GB 11: nums := make([]int, 0, n) . . 12: for i := 0; i < n; i++ { . . 13: nums = append(nums, i) . . 14: } . . 15: return nums . . 16:} (pprof)
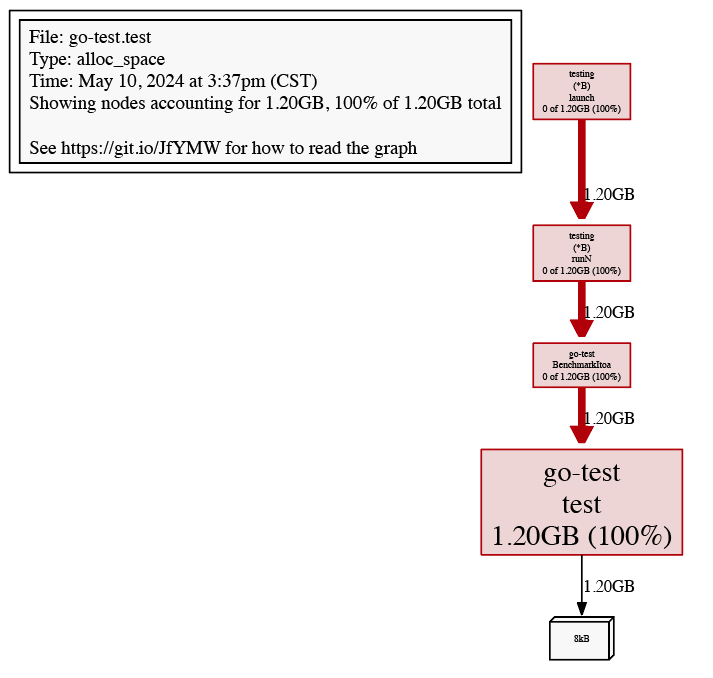
web:web
命令可以在浏览器中打开一个页面,以图形的形式展示性能测试结果,如下
weblist:weblist
命令可以在浏览器中打开一个页面,显示函数的源代码,突出显示哪些代码占用了最多的
CPU 或内存,如:
1
2
3
4
5
6
7
8
9
10
11
12
13
14
15
// ... 其他内容 /Users/ruby/GolandProjects/go-test/fib_test.go Total: 1.20GB 1.20GB (flat, cum) 100% 6 . . "time" 7 . . ) 8 . . 9 . . func test(n int) []int { 10 . . rand.Seed(time.Now().UnixNano()) 11 1.20GB 1.20GB nums := make([]int, 0, n) 12 . . for i := 0; i < n; i++ { 13 . . nums = append(nums, i) 14 . . } 15 . . return nums // ... 其他内容
1
2
3
4
5
6
7
8
9
10
(pprof) peek go-test.test Active filters: show=go-test.test Showing nodes accounting for 1.20GB, 100% of 1.20GB total ----------------------------------------------------------+------------- flat flat% sum% cum cum% calls calls% + context ----------------------------------------------------------+------------- 1.20GB 100% | go-test.BenchmarkItoa 1.20GB 100% 100% 1.20GB 100% | go-test.test ----------------------------------------------------------+-------------
1
2
3
4
5
6
7
8
9
(pprof) text Active filters: show=go-test.test Showing nodes accounting for 1.20GB, 100% of 1.20GB total flat flat% sum% cum cum% 1.20GB 100% 100% 1.20GB 100% go-test.test 0 0% 100% 1.20GB 100% go-test.BenchmarkItoa 0 0% 100% 1.20GB 100% testing.(*B).launch 0 0% 100% 1.20GB 100% testing.(*B).runN
各种形式的输出:pprof 还支持其他的输出形式,比如
pdf、png、svg 等,具体可以查看
help 命令。
testing.B 的其他方法
最后,再简单介绍一下 testing.B 的其他方法:
b.ResetTimer():重置计时器,可以在测试函数中的循环体中使用,以避免循环体的初始化时间影响测试结果。
1
2
3
4
5
6
7
8
func BenchmarkFib (b *testing.B) time.Sleep(1 * time.Second) b.ResetTimer() for i := 0 ; i < b.N; i++ { fib(20 ) } }
b.StartTimer():负责启动计时并初始化内存相关计数,测试执行时会自动调用,一般不需要用户启动。b.StopTimer():负责停止计时,并累加相应的统计值。b.ReportAllocs():用于设置是否打印内存统计信息,与命令行参数
-benchmem 一致,但本方法只作用于单个测试函数。b.SetParallelism(p int):设置并行测试的线程数,设置为
p*GOMAXPROCS。影响 b.RunParallel
的并行度。b.RunParallel(body func(*PB)):用于并行测试,body
函数会被并行执行,b.N 会被分配到各个并行体中。通常跟
-cpu 参数一起使用。
其他方法跟 testing.T
有很多重复的,这里不赘述了,可以看上一篇。
高阶用法
指定性能测试时间
可以通过 -benchtime 参数来指定性能测试的时间,如:
1 go test -bench . -benchtime=3s
输出:
1
2
3
4
5
6
7
goos: darwin goarch: amd64 pkg: go-test cpu: 12th Gen Intel(R) Core(TM) i7-12700F BenchmarkItoa-20 499718 7051 ns/op PASS ok go-test 3.602s
指定性能测试执行次数,也就是
b.N
也是通过 -benchtime 参数来指定,但是单位是
x,如:
1 go test -bench . -benchtime=3x
输出:
1
2
3
4
5
6
7
goos: darwin goarch: amd64 pkg: go-test cpu: 12th Gen Intel(R) Core(TM) i7-12700F BenchmarkItoa-20 3 14378 ns/op PASS ok go-test 0.005s
执行多次性能测试
可以通过 -count 参数来指定执行多少次性能测试,如:
1 go test -bench . -count=3
输出:
1
2
3
4
5
6
7
8
9
goos: darwin goarch: amd64 pkg: go-test cpu: 12th Gen Intel(R) Core(TM) i7-12700F BenchmarkItoa-20 166116 7187 ns/op BenchmarkItoa-20 165289 7168 ns/op BenchmarkItoa-20 161872 7146 ns/op PASS ok go-test 3.765s
指定性能测试的 CPU 数
可以通过 -cpu 参数来指定性能测试的 CPU 数,如:
1 go test -bench . -cpu=1,2,4
这个命令会执行多次性能测试,分别使用 1、2、4 个 CPU(也就是
GOMAXPROCS 的值分别为 1、2、4)。
输出:
1
2
3
4
5
6
7
8
9
goos: darwin goarch: amd64 pkg: go-test cpu: 12th Gen Intel(R) Core(TM) i7-12700F BenchmarkItoa 166363 7153 ns/op BenchmarkItoa-2 170436 7114 ns/op BenchmarkItoa-4 171088 6976 ns/op PASS ok go-test 3.819s
输出内存分配信息
可以通过 -benchmem 参数来输出内存分配信息,如:
1 go test -bench . -benchmem
输出:
1
2
3
4
5
6
7
goos: darwin goarch: amd64 pkg: go-test cpu: 12th Gen Intel(R) Core(TM) i7-12700F BenchmarkItoa-20 163878 7081 ns/op 896 B/op 1 allocs/op PASS ok go-test 1.240s